工作早期使用的Neflow分析軟體NfSen太舊了(官方已無更新),加上新版的瀏覽器無法完全支援,索性將全部的Netflow網管主機換成比較新的分析軟體ElastiFlow來收集資料,然後再用 Grafana 去畫出自己想要的圖型分析跟告警發送。目前官方ElastiFlow Open Source的版本到4.0.1之後,就變成了收費軟體了,基於使用上的彈性,所以還是使用該版本做為使用。 以下為安裝的方式,會使用docker的方式來安裝ELK軟體,然後手動安裝Grafana軟體,並在做完必要的設定佈署後,會將Kibana給停用,節省主機的效能資源,因為是3種服務都安裝在同一台的方式,所以硬體效能不能太差(官方有建議的Flow per second對應的硬體規格),以下為使用12 core 、46G RAM、1T HD的方式佈署。
先安裝Docker軟體
yum install -y
yum-utils device-mapper-persistent-data lvm2
yum-config-manager --add-repo https://download.docker.com/linux/centos/docker-ce.repo
yum makecache fast
yum install docker-ce
確認安裝是否成功,並將服務加到開機會自動啟動
docker --version
sudo systemctl enable
docker.service
sudo systemctl start docker.service
sudo systemctl status docker.service
安裝Docker Compose,之後可以用YAML 檔案來定義服務
curl -L "https://github.com/docker/compose/releases/download/1.24.1/docker-compose-$(uname
-s)-$(uname -m)" -o /usr/local/bin/docker-compose
sudo chmod +x /usr/local/bin/docker-compose
檢查安裝是否有成功
docker-compose -v
接著照著ElastiFlow官方文件上面的建議,定義好YAML 檔案與優化Linux主機的UDP的效能
編輯vi /etc/sysctl.d/87-elastiflow.conf ,然後加入官方的建議UDP設定值 ,接著照著主機的效能規格去定義好相關的YAML檔案來使用Docker來啟動ELK服務收集Netflow資料
vi docker-compose.yml ,紅色的地方照實際需求修改對應的設定值
version: '3'

services:
  elastiflow-elasticsearch:
    image: docker.elastic.co/elasticsearch/elasticsearch:7.8.1
    container_name: elastiflow-elasticsearch
    restart: 'always'
    ulimits:
      memlock:
        soft: -1
        hard: -1
      nofile:
        soft: 131072
        hard: 131072
      nproc: 8192
      fsize: -1
    network_mode: host
    volumes:
      # 使用下面命令建立數據目錄(把Netflow檔案放在Docker的外層本機目錄中)
      # mkdir /qyt_elastiflow && chown -R 1000:1000 /qyt_elastiflow
      - /qyt_elastiflow:/usr/share/elasticsearch/data
    environment:
      # JVM Heap size
      #   - 照使用的規格定義JVM的可用的Ram Size
      #   - 此處設定為25G
      ES_JAVA_OPTS: '-Xms25g -Xmx25g'
      cluster.name: elastiflow
      bootstrap.memory_lock: 'true'
      network.host: 0.0.0.0
      http.port: 9200
      discovery.type: 'single-node'
      indices.query.bool.max_clause_count: 8192
      search.max_buckets: 250000
      action.destructive_requires_name: 'true'

  elastiflow-kibana:
    image: docker.elastic.co/kibana/kibana:7.8.1
    container_name: elastiflow-kibana
    restart: 'no'
    depends_on:
      - elastiflow-elasticsearch
    network_mode: host
    environment:
      SERVER_HOST: 0.0.0.0
      SERVER_PORT: 5601
      SERVER_MAXPAYLOADBYTES: 8388608

      ELASTICSEARCH_HOSTS: "http://127.0.0.1:9200"
      ELASTICSEARCH_REQUESTTIMEOUT: 132000
      ELASTICSEARCH_SHARDTIMEOUT: 120000

      KIBANA_DEFAULTAPPID: "dashboard/653cf1e0-2fd2-11e7-99ed-49759aed30f5"
      KIBANA_AUTOCOMPLETETIMEOUT: 3000
      KIBANA_AUTOCOMPLETETERMINATEAFTER: 2500000

      LOGGING_DEST: stdout
      LOGGING_QUIET: 'false'

  elastiflow-logstash:
    image: robcowart/elastiflow-logstash:4.0.1
    container_name: elastiflow-logstash
    restart: 'always'
    depends_on:
      - elastiflow-elasticsearch
    network_mode: host
    environment:
      # JVM Heap size - this MUST be at least 3GB (4GB preferred)
      LS_JAVA_OPTS: '-Xms5g -Xmx5g'

      # ElastiFlow global configuration
      ELASTIFLOW_AGENT_ID: elastiflow
      ELASTIFLOW_GEOIP_CACHE_SIZE: 16384
      ELASTIFLOW_GEOIP_LOOKUP: 'true'
      ELASTIFLOW_ASN_LOOKUP: 'true'
      ELASTIFLOW_OUI_LOOKUP: 'false'
      ELASTIFLOW_POPULATE_LOGS: 'true'
      ELASTIFLOW_KEEP_ORIG_DATA: 'true'
      ELASTIFLOW_DEFAULT_APPID_SRCTYPE: '__UNKNOWN'

      # Name resolution option
      ELASTIFLOW_RESOLVE_IP2HOST: 'false'
      ELASTIFLOW_NAMESERVER: '127.0.0.1'
      ELASTIFLOW_DNS_HIT_CACHE_SIZE: 25000
      ELASTIFLOW_DNS_HIT_CACHE_TTL: 900
      ELASTIFLOW_DNS_FAILED_CACHE_SIZE: 75000
      ELASTIFLOW_DNS_FAILED_CACHE_TTL: 3600

      ELASTIFLOW_ES_HOST: '127.0.0.1:9200'
      ELASTIFLOW_NETFLOW_IPV4_PORT: 2055
      ELASTIFLOW_NETFLOW_UDP_WORKERS: 2
      ELASTIFLOW_NETFLOW_UDP_QUEUE_SIZE: 4096
      ELASTIFLOW_NETFLOW_UDP_RCV_BUFF: 33554432

      ELASTIFLOW_SFLOW_IPV4_PORT: 6343
      ELASTIFLOW_SFLOW_UDP_WORKERS: 2
      ELASTIFLOW_SFLOW_UDP_QUEUE_SIZE: 4096
      ELASTIFLOW_SFLOW_UDP_RCV_BUFF: 33554432

      ELASTIFLOW_IPFIX_UDP_IPV4_PORT: 4739
      ELASTIFLOW_IPFIX_UDP_WORKERS: 2
      ELASTIFLOW_IPFIX_UDP_QUEUE_SIZE: 4096
      ELASTIFLOW_IPFIX_UDP_RCV_BUFF: 33554432
接著在Linux上面先設定好NetFlow存放的外層目錄
mkdir /qyt_elastiflow && chown -R 1000:1000 /qyt_elastiflow
接著佈署容器,等待一段時間後、可瀏覽器中進入Kibana圖形化界面
docker-compose up -d
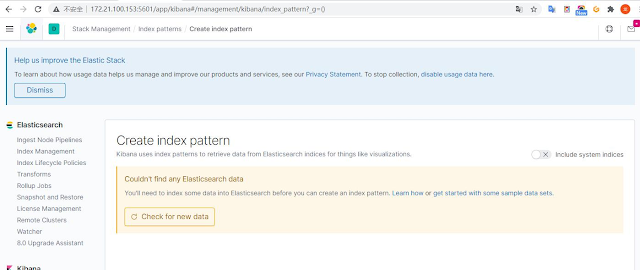
因為目前還沒有Netflow (UDP-2055)或是Sflow(UDP-6343)或是IPFX(UDP-4739)的資料丟入,所以會顯示無資料,此時需要去網路設備上面設定相關的Flow Exporter的發送設定,可參考先前文章的設定,LAB環境是使用RouterOS
在Kibana建立對應的索引
建立index pattern
名字取為elastiflow-4.0.1-*
接著選@timestamp 做為index的分類名
import elastiflow.kibana.7.8.x.ndjson 的內建面板(之後會用Grafana取代,非必要動作)
檔案從這邊捉取
匯入完成後,可以在界面中看到多個dashboards信息

接著在Linux上面先設定好需要的本機ACL
給本機自己讀取ElasticSearch
firewall-cmd --permanent --zone=public --add-rich-rule="rule family="ipv4" source address="192.168.88.5/32" port port="9200" protocol="tcp" accept"
給之後Grafana讀取ElasticSearch
firewall-cmd --permanent --zone=public --add-rich-rule="rule family="ipv4" source address="192.168.88.5/32" port port="9200" protocol="tcp" accept"
給第一次做import面板使用Kibana UI
firewall-cmd --permanent --zone=public --add-rich-rule="rule family="ipv4" source address="192.168.88.0/24" port port="5601" protocol="tcp" accept"
給NetFlow、Sflow、IPFX收取資料的服務端口
firewall-cmd --permanent --add-port=2055/udp
firewall-cmd --permanent --add-port=6343/udp
firewall-cmd --permanent --add-port=4739/udp
重新讀入新的ACL清單
firewall-cmd --reload
firewall-cmd --list-all --permanent
接著透過Kibana做index資料存放天數的設定,可照實際硬碟空間與每日的NetFlow資料量設定
此處建立一組lifecycle的規則叫做elastiflow
接著回到Index Management頁面,確定相關的狀態是否都為正常
因為只有一台ElastiSearch,要改一下shards與replicas的數量如下,不然不會顯示Green狀態
number_of_shards": "1"
number_of_replicas": "0"
將全部的容器都給開機的指令
docker-compose up -d
將全部的容器都給關機的指令
docker-compose stop
查詢目前使用中容器的指令
docker ps -a
查出目前執行中的容器的CONTAINER ID,並上網捉取GeoIP的資料庫放到本機中
更新一下
GeoIP的資料庫到新版,用docker指令放到容器裡面的目錄
docker cp GeoLite2-ASN.mmdb af9ba8d2e4f9:/etc/logstash/elastiflow/geoipdbs/GeoLite2-ASN.mmdb
docker cp GeoLite2-City.mmdb af9ba8d2e4f9:/etc/logstash/elastiflow/geoipdbs/GeoLite2-City.mmdb
接著進入elastiflow-logstash的容器裡去調整shards與replicas的數量
docker exec -it 7e3dd0e3d558 /bin/bash
在容器裡面修改confg檔
vi templates/elastiflow.template.json
存檔後退出,再重新reload容器重帶服務後,設定便會生效
docker-compose stop
docker-compose up -d
docker ps -a
接著要使用Grafana來取代Kibana的畫圖功能,主要是Grafana可以做更好的圖表呈現與帳號的權限管理,在Kibana上面,這些都需要另外付費xpack授權才可以使用,Grafana的安裝方式如下
先新增Grafana Repository
vi /etc/yum.repos.d/grafana.repo
[grafana]
name = grafana
baseurl = https://packages.grafana.com/oss/rpm
repo_gpgcheck = 1
enabled = 1
gpgcheck = 1
gpgkey = http://packages.grafana.com/gpg.key
sslverify = 1
sslcacert = /etc/pki/tls/certs/ca-bundle.crt
安裝Grafana
yum install grafana
啟動grafana服務
systemctl daemon-reload
systemctl start grafana-server
查詢grafana服務狀態
systemctl status grafana-server
設定開機時自動啟動grafana服務
systemctl enable grafana-server.service
因為會使用Grafana來發送告警,所以需要先安裝告警發送的外掛
grafana-cli plugins install grafana-image-renderer
yum install -y alsa-lib.x86_64 atk.x86_64 cups-libs.x86_64 gtk3.x86_64 ipa-gothic-fonts libXcomposite.x86_64 libXcursor.x86_64 libXdamage.x86_64 libXext.x86_64 libXi.x86_64 libXrandr.x86_64 libXScrnSaver.x86_64 libXtst.x86_64 pango.x86_64 xorg-x11-fonts-100dpi xorg-x11-fonts-75dpi xorg-x11-fonts-cyrillic xorg-x11-fonts-misc xorg-x11-fonts-Type1 xorg-x11-utils
yum update nss -y
service grafana-server restart
接著就能開啟瀏覽器輸入http://<IP_Address>:3000登入,預設的帳號密碼都是admin
先對Grafana做一下設定config參數調整
vi /etc/grafana/grafana.ini (調整基本環境參數)
#################################### Server ####################################
[server]
# Protocol (http, https, h2, socket)
protocol = https
# The ip address to bind to, empty will bind to all interfaces
;http_addr =
# The http port to use
;http_port = 3000
# The public facing domain name used to access grafana from a browser
domain = 192.168.88.5
# https certs & key file
cert_file = /etc/grafana/cert.pem
cert_key = /etc/grafana/key.pem
#################################### Security ####################################
[security]
# disable creation of admin user on first start of grafana
;disable_initial_admin_creation = false
# default admin user, created on startup
;admin_user = admin
#改掉預設建立的密碼
# default admin password, can be changed before first start of grafana, or in profile settings
;admin_password = LAB58TT78V9XXX
# used for signing
;secret_key = AA2YcXXXTIGTY1LOhoPsMBB
#################################### Analytics ####################################
[analytics]
# Server reporting, sends usage counters to stats.grafana.org every 24 hours.
# No ip addresses are being tracked, only simple counters to track
# running instances, dashboard and error counts. It is very helpful to us.
# Change this option to false to disable reporting.
reporting_enabled = false
#################################### Auth LDAP ##########################
[auth.ldap]
enabled = true
config_file = /etc/grafana/ldap.toml
allow_sign_up = true
#;enabled = false
#;config_file = /etc/grafana/ldap.toml
#;allow_sign_up = true
#################################### SMTP / Emailing ##########################
[smtp]
enabled = true
host = smtp.hinet.net:25
;user =
# If the password contains # or ; you have to wrap it with triple quotes. Ex """#password;"""
;password =
;cert_file =
;key_file =
;skip_verify = false
from_address = NetFlow-LAB@LAB.com
from_name = NetFlow-LAB
# EHLO identity in SMTP dialog (defaults to instance_name)
ehlo_identity = LAB.com
# SMTP startTLS policy (defaults to 'OpportunisticStartTLS')
;startTLS_policy = NoStartTLS
#################################### Logging ##########################
[log]
# Either "console", "file", "syslog". Default is console and file
# Use space to separate multiple modes, e.g. "console file"
;mode = console file
# Either "debug", "info", "warn", "error", "critical", default is "info"
level = debug
#;level = info
# optional settings to set different levels for specific loggers. Ex filters = sqlstore:debug
;filters =
filters = ldap:debug
#################################### Grafana Image Renderer Plugin ##########################
[plugin.grafana-image-renderer]
# Instruct headless browser instance to use a default timezone when not provided by Grafana, e.g. when rendering panel image of alert.
# See ICU’s metaZones.txt (https://cs.chromium.org/chromium/src/third_party/icu/source/data/misc/metaZones.txt) for a list of supported
# timezone IDs. Fallbacks to TZ environment variable if not set.
;rendering_timezone =
# Instruct headless browser instance to use a default language when not provided by Grafana, e.g. when rendering panel image of alert.
# Please refer to the HTTP header Accept-Language to understand how to format this value, e.g. 'fr-CH, fr;q=0.9, en;q=0.8, de;q=0.7, *;q=0.5'.
;rendering_language =
# Instruct headless browser instance to use a default device scale factor when not provided by Grafana, e.g. when rendering panel image of alert.
# Default is 1. Using a higher value will produce more detailed images (higher DPI), but will require more disk space to store an image.
;rendering_viewport_device_scale_factor =
# Instruct headless browser instance whether to ignore HTTPS errors during navigation. Per default HTTPS errors are not ignored. Due to
# the security risk it's not recommended to ignore HTTPS errors.
#若有使用https的話,這個地方要改成true略過
rendering_ignore_https_errors = true
# Instruct headless browser instance whether to capture and log verbose information when rendering an image. Default is false and will
# See ICU’s metaZones.txt (https://cs.chromium.org/chromium/src/third_party/icu/source/data/misc/metaZones.txt) for a list of supported
# timezone IDs. Fallbacks to TZ environment variable if not set.
;rendering_timezone =
# Instruct headless browser instance to use a default language when not provided by Grafana, e.g. when rendering panel image of alert.
# Please refer to the HTTP header Accept-Language to understand how to format this value, e.g. 'fr-CH, fr;q=0.9, en;q=0.8, de;q=0.7, *;q=0.5'.
;rendering_language =
# Instruct headless browser instance to use a default device scale factor when not provided by Grafana, e.g. when rendering panel image of alert.
# Default is 1. Using a higher value will produce more detailed images (higher DPI), but will require more disk space to store an image.
;rendering_viewport_device_scale_factor =
# Instruct headless browser instance whether to ignore HTTPS errors during navigation. Per default HTTPS errors are not ignored. Due to
# the security risk it's not recommended to ignore HTTPS errors.
#若有使用https的話,這個地方要改成true略過
rendering_ignore_https_errors = true
vi /etc/grafana/ldap.toml (調整ldap的認證環境參數)
設定完成後,重帶Grafana服務
service grafana-server stop
service grafana-server start
上面設定完成後便可以登入Grafana,此時已將登入網頁設定改成了https://IP:3000,開始先指定好要使用的Data Source,這裡為讀取ElasticFlow存在ELK的NetFlow資料
從Configuration >> add data source (選Elasticsearch格式)
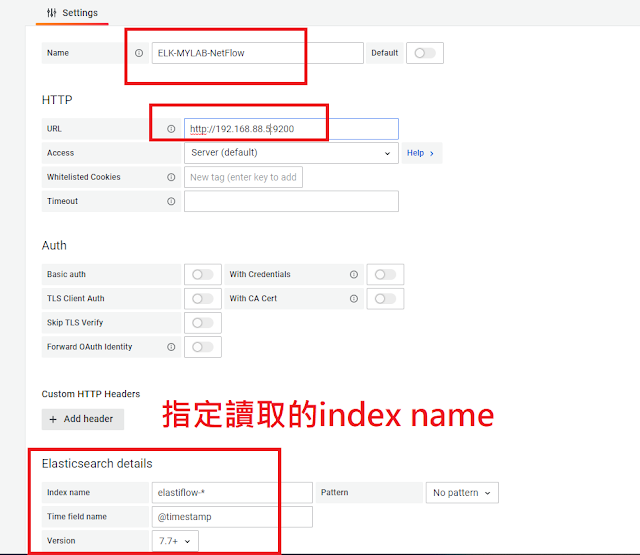
選好後送出存檔測試讀取Data Source,若有出現Index OK. Time field name OK的訊息,代表已可讀入資料,剩下的就是照需要的條件,在Grafana裡面拉出自己需要的圖型分析介面
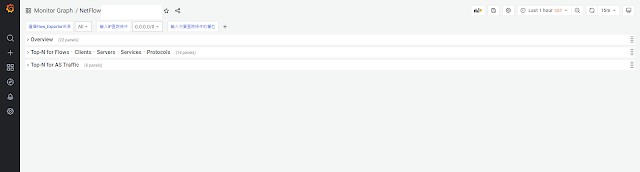
至於圖型分析的條件式要怎麼來跟應用,可以參考原本這組ElastiFlow軟體作業建立在Kibana面板裡面的語法設定,基本上只要熟悉ElasticSearch的API查詢語法與網路流量的單位換算,花點時間就可以把整個圖型分析給拉完了,成果如下圖
也可以建立查詢用的面板,Grafana面板客製化彈性很高,依照個人需求拉出要的格式即可
如果建立好圖型樣版的話,想備份的話,面板備份的目錄是存在下面的路徑
/var/lib/grafana
最後再寫支監控Grafana服務用的Script來監控服務即完成
[root@LAB-NetFlow ~]# vi grfana-process-monitor.sh
#!/bin/bash
smokeping_status=`ps aux | grep grafana-server | grep -v grep | wc -l `
if [ ${smokeping_status} = 0 ]; then
echo "Grafana-Services 服務異常,請檢查"
data='{
"username": "'${HOSTNAME}'",
"icon_url": "https://dyltqmyl993wv.cloudfront.net/assets/stacks/grafana-image-renderer/img/grafana-image-renderer-stack-220x234.png",
"attachments": [
{
"title": "Grafana服務狀態 : 狀態異常",
"color": "#ff0000",
"text": " 請檢查'${HOSTNAME}' Grafana Process狀態"
}
],
"channel": "#LAB-alert"
}'
echo $data
curl -X POST -H "Content-type: application/json" --data "$data" https://hooks.slack.com/services/ZZAAXXZZ/CCCCGBBBGGGGGLF9ADGGDDDDDD
exit 2
else
echo "Grafana-Services 服務正常運作中"
exit 0
fi
另外,先前說過只要Grafana的圖型完成後,便不需要Kibana了,所以可以將容器中的Kibana停用與移掉相關的ACL
停用單一容器服務(先找出對應的容器ID)
docker stop ed0a8690d562
移掉Kibana用的本機ACL
firewall-cmd --permanent --zone=public --remove-rich-rule="rule family="ipv4" source address="192.168.88.0/24" port port="5601" protocol="tcp" accept"
firewall-cmd --reload
firewall-cmd --list-all --permanent
另外Grafana面板或是設定檔想要複製到別台機器上使用的話,下面為主要的目錄與Config位置
/var/lib/grafana/grafana.db
/etc/grafana/grafana.ini
/etc/grafana/ldap.toml
以上即完成整個ElastiFlow與Grafana的安裝與設定


2 回應:
这个文章很不错,如何在grafana中展示,可以细节一些嘛?
可以參考kibana裡面的查找條件,去grafana裡面拉出對應的面板,這兩個是差不多的東西,只要下的查找條件一樣,都可以產生對應的圖型分析
張貼留言